by Jack Norris, RD
Contents
- Essential information
- Additional tips
- Protein requirements
- Plant protein requirements
- Plant vs. animal protein: observational research
- Amino acid intakes and blood levels of vegans
Essential information
“Where do you get your protein?” is typically the first question vegans are asked. It can be hard to answer because almost all plant foods contain protein, so vegans are getting protein from everything they eat.
We generally encourage vegans to eat 1 g of protein for every kg of body weight per day. For a 150 lb person, that translates to 68 g of protein. Athletes might need more and should experiment with varying amounts to find the best results; see Sports Nutrition for more information about vegan athletes’ protein needs. There’s evidence that as people age, they need a higher percentage of their calories to be protein; people over 60 should focus on making high-protein foods a large part of their meals. And vegans who aren’t eating enough calories to maintain their weight should make an effort to include a higher percentage of protein.
Anyone who’s regularly been eating meat and cheese is used to high amounts of protein and if you’re craving animal products or feeling fatigued on a vegan diet, adding more protein is often the solution.
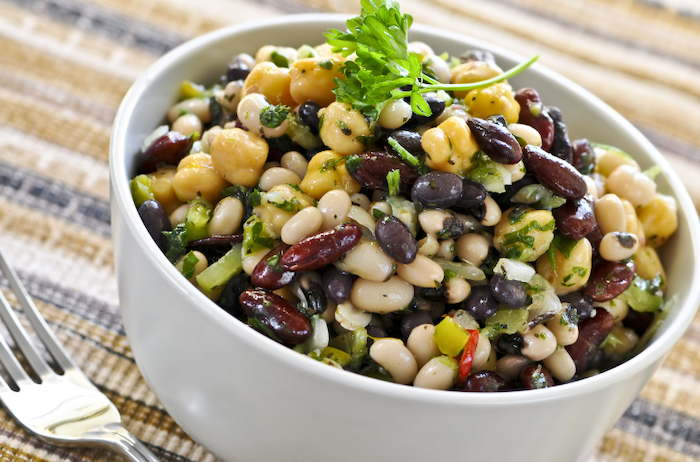
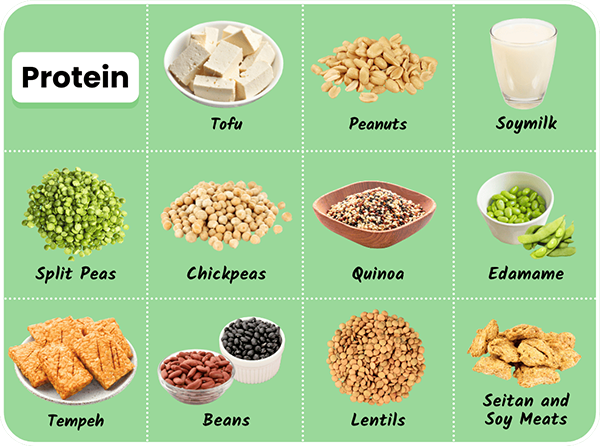
High-protein plant foods include seitan and most vegan meats (about 15-25 grams per serving, but check the label), tempeh (about 15 grams per 1/2 cup), tofu (about 10-15 grams per 1/2 cup), peanuts (about 15 grams per 1/2 cup), beans and lentils (about 8 grams per 1/2 cup), and soymilk (about 7 grams per cup).
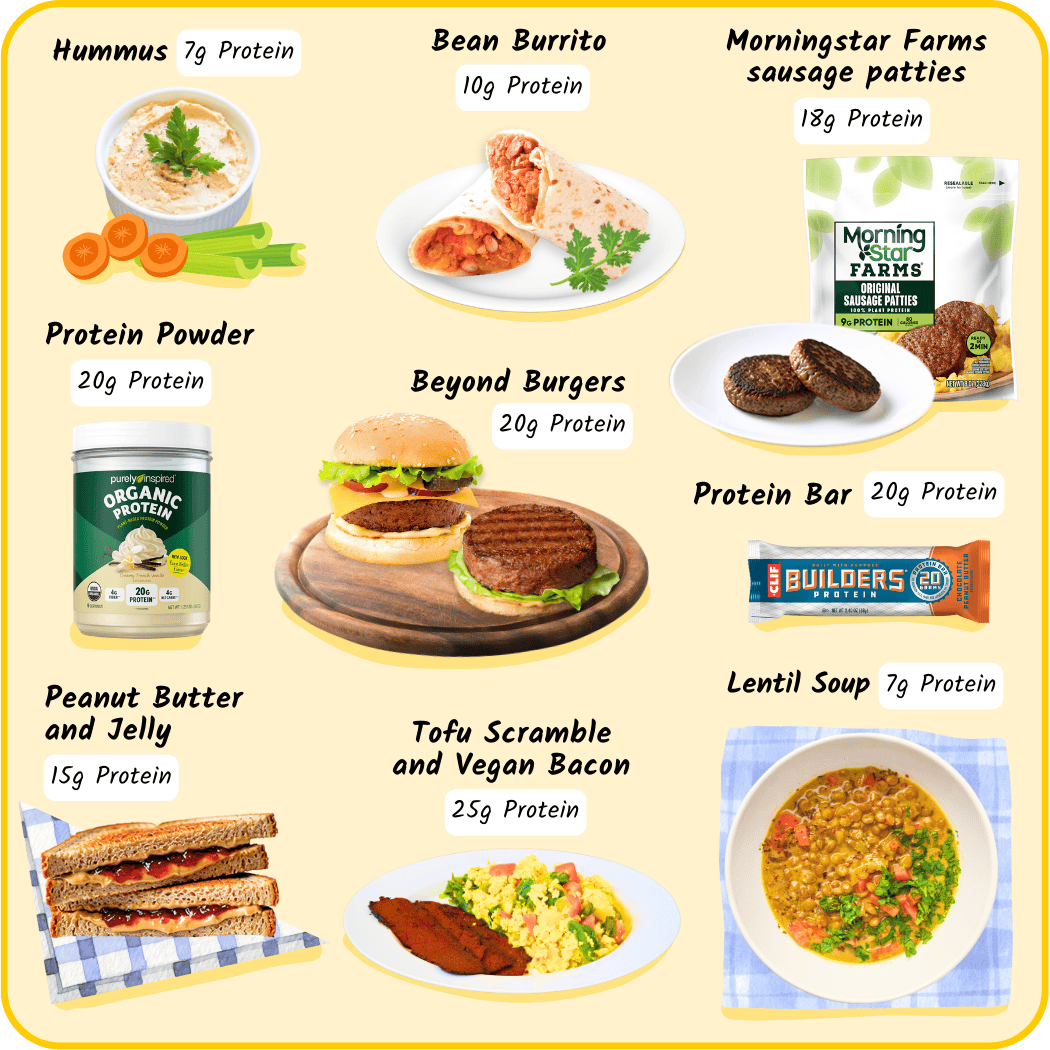
Here are some typical high-protein entrees and snacks:
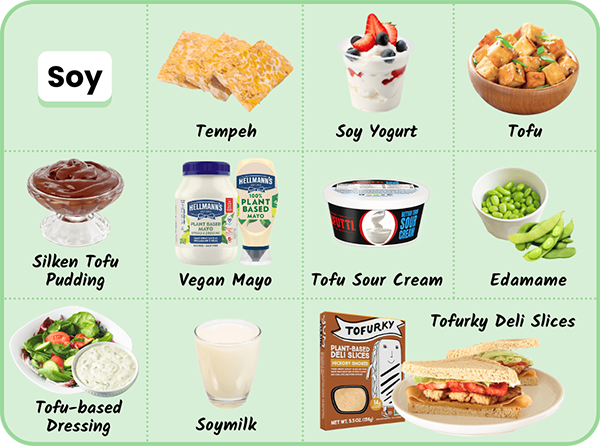
Soy
Speaking of protein, soyfoods have traditionally been a staple of many vegan diets due to their high protein content. Myths abound that soy is harmful and that has made some people shy away, but there’s plenty of scientific evidence that two servings of soyfoods per day is perfectly safe. Higher amounts are probably also safe but they haven’t been studied as thoroughly. As a vegan dietitian, athlete, and someone familiar with the scientific research on soy, I happily eat as much soy as I desire!
The most robust area of research on soy has been with respect to breast cancer and the overwhelming evidence is that soy can reduce the risk of breast cancer. There’s also evidence to suggest that soy can reduce the risk of prostate cancer and heart disease (by lowering LDL cholesterol). You can read more in our article Soy: Main Controversies.
Tofu is an extremely versatile soyfood that has been eaten in some Asian cultures for hundreds of years. You can fry or bake it and add it to just about any savory dish. You can also freeze and then thaw it to give it a chewy texture. Tofu doesn’t have much taste on its own, but it takes on the flavors of the foods it’s mixed with.
Tofu is normally made with calcium salts and is therefore a rich source of calcium for vegans (check the packaging for “calcium” in the ingredients).
Another type of tofu, silken tofu, has a smooth texture and is used for making pudding, mousse, and cream-based pies. Silken tofu is often found in the baking or Asian sections of the grocery store.
While most vegans eat soyfoods, you don’t need to in order to be a vegan as there are plenty of other high-protein foods. But unless you have a specific allergy to soy, there’s no reason why you can’t enjoy it just like millions of other people throughout the world, vegans and meat-eaters alike.
Additional tips
Protein is made of amino acids, some of which our bodies don’t make so must be obtained from our diet. Lysine is the essential amino acid that vegans should pay the most attention to. To ensure adequate protein status, vegans should eat 3-4 servings per day of high-protein foods that are also good sources of lysine.
Good sources of lysine
With an RDA ranging from about 1,700 to 3,500 mg of lysine per day, it’s hard to design a vegan diet that meets lysine requirements without including some of the following high-lysine foods (containing at least 350 mg of lysine per serving):
- Beans (1/2 cup cooked / 125-150 g): garbanzo (chickpea), kidney, pinto, navy
- Lentils (1/2 cup cooked / 100 g)
- Peas: split (1/2 cup cooked / 100 g) or green (1/2 cup cooked / 80 g)
- Soyfoods: edamame (1/2 cup cooked / 80 g), tofu (1/2 cup cooked / 125 g), tempeh (1/2 cup cooked / 165 g), soy milk (1 cup / 250 mL), soy meats (3 oz / 85 g)
- Peanuts (1/4 cup/ 35-40 g)
- Seitan (3 oz / 85 grams)
- Quinoa (1 cup cooked / 185 g)
- Pistachios (1/4 cup / 30 g)
- Pumpkin seeds (1/4 cup roasted / 35 g)
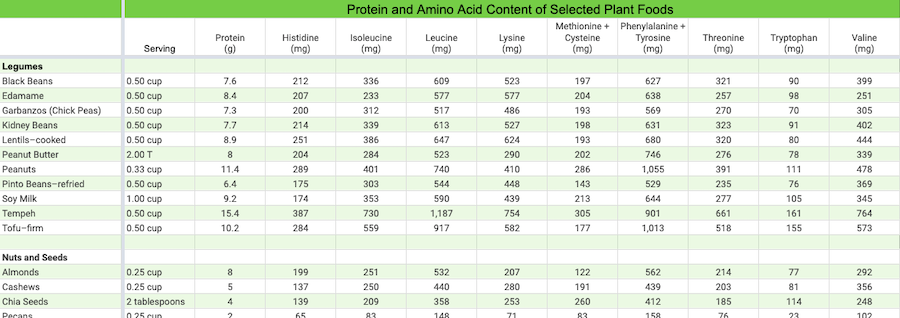
Protein and amino acid content of selected plant foods
See our online spreadsheet, Protein and Amino Acid Content of Selected Plant Foods.
Protein requirements
Author’s note: For this section, I used AI tools in the literature search, analysis, data extraction, and copyediting. The conclusions reflect my assessment after verifying study details. (Last reviewed: March 2026.)
Summary. Protein needs vary considerably among adults, with older people having slightly higher needs on average; athletes can have considerably higher needs. For your average vegan, we recommend obtaining at least 1.0 g of protein per kg of body weight per day. Athletes should experiment with amounts from 1.0 to 1.6 g/kg.
Table 1 provides examples of target protein amounts and how they can be translated for people of different weights.
| Table 1. Protein targets per body weight and estimated calories | ||||
|---|---|---|---|---|
| Target | Body weight | Protein (g) | Kcal | Protein % |
| 0.80 g/kg | 100 lb / 45.4 kg 125 lb / 56.7 kg 150 lb / 68.0 kg 175 lb / 79.4 kg 200 lb / 90.7 kg |
36 g 45 g 54 g 64 g 73 g |
1,500 kcal 1,875 kcal 2,250 kcal 2,625 kcal 3,000 kcal |
9.6% 9.6% 9.6% 9.8% 9.7% |
| 1.00 g/kg | 100 lb / 45.4 kg 125 lb / 56.7 kg 150 lb / 68.0 kg 175 lb / 79.4 kg 200 lb / 90.7 kg |
45 g 57 g 68 g 79 g 91 g |
1,500 kcal 1,875 kcal 2,250 kcal 2,625 kcal 3,000 kcal |
12.0% 12.2% 12.1% 12.0% 12.1% |
| 1.20 g/kg | 100 lb / 45.4 kg 125 lb / 56.7 kg 150 lb / 68.0 kg 175 lb / 79.4 kg 200 lb / 90.7 kg |
54 g 68 g 82 g 95 g 109 g |
1,500 kcal 1,875 kcal 2,250 kcal 2,625 kcal 3,000 kcal |
14.4% 14.5% 14.6% 14.5% 14.5% |
| 1.60 g/kg | 100 lb / 45.4 kg 125 lb / 56.7 kg 150 lb / 68.0 kg 175 lb / 79.4 kg 200 lb / 90.7 kg |
73 g 91 g 109 g 127 g 145 g |
1,500 kcal 1,875 kcal 2,250 kcal 2,625 kcal 3,000 kcal |
19.5% 19.4% 19.4% 19.4% 19.3% |
| Assumptions: estimated calories ≈ 15 kcal per lb body weight; protein calories = 4 kcal/g; kg = lb × 0.45359237. | ||||
Protein needs of the general population
Before we talk about the protein needs of vegans, we should discuss the protein needs of the general population, because they aren’t without controversy.
Discussions about protein needs tend to focus on three different lines of reasoning:
- Protein balance studies
- Muscle synthesis studies
- Protein quality scoring
Protein balance studies are the most relevant studies for assessing the protein needs of a well-nourished population. Protein quality scoring is mostly relevant to populations at risk of malnutrition (see Appendix A. Protein Quality Scoring). Muscle synthesis studies are usually focused on athletes (see Weightlifting for Vegans), though there are exceptions (see Appendix C. Muscle Synthesis Studies).
In the United States, dietary reference intakes (DRIs) for protein were last set in 2005 by the Institute of Medicine (IOM). The DRIs include the recommended dietary allowance (RDA).
The DRI for protein is stated in grams per kilogram (g/kg) of body weight. Fat mass doesn’t require much protein for maintenance, so body weight is generally interpreted to mean ideal or healthy body weight, even though this isn’t specified.
Table 2 lists the DRI for protein. The table also includes the DRI for the amino acid lysine, because lysine is the essential amino acid least plentiful in the average vegan diet; if a vegan is meeting their lysine needs, they’re most likely meeting their needs for all essential amino acids.
| Table 2. Dietary reference intakes for protein and lysine | ||
|---|---|---|
| Age | Protein (g/kg)A | Lysine (mg/kg)A |
| 7–12 mos | 1.20 | 89 |
| 1–3 | 1.05 | 58 |
| 4–8 | 0.95 | 46 |
| 9–13 male | 0.95 | 46 |
| 9–13 female | 0.95 | 43 |
| 14-18 male | 0.85 | 43 |
| 14-18 female | 0.85 | 40 |
| ≥ 19 | 0.80 | 38 |
| Pregnancy | 1.1 | 51 |
| Breastfeeding | 1.3 | 52 |
| Aper kg of body weight | ||
In setting the DRSs for protein, the IOM relied on nitrogen balance studies, especially a 2003 meta-analysis by Rand et al. (2003). Nitrogen balance studies are used because nitrogen is a component of protein that isn’t found in the other macronutrients (i.e., fat, carbohydrate, and alcohol). The IOM determined that the estimated average requirement (EAR) for protein for adults aged 19-50 years is 0.66 g/kg/day. Based on the EAR, they set the recommended dietary allowance (RDA) at 0.8 g/kg/day to cover the needs of 97–98% of the population.
Since the RDAs were set in 2005, they’ve been criticized for being too low, especially for older adults. Some researchers suggest that nitrogen balance studies underestimate protein needs and that isotope-based, indicator amino acid oxidation (IAAO) studies should be used instead (Elango, 2010).
Tagawa et al. (2025) conducted a meta-analysis of nitrogen balance and IAAO studies. Table 3 reports the average protein requirements they found. Because the RDA adds a safety margin to cover most people’s needs, Table 3 also includes columns showing the corresponding “population‑safe” requirements.
| Table 3. Protein requirements determined by nitrogen balance and IAAO | ||||||
|---|---|---|---|---|---|---|
| Nitrogen Balance | IAAO | |||||
| Protein Requirement g/kg | Number | Population‑safe1 g/kg | Protein Requirement g/kg | Number | Population‑safe1 g/kg |
|
| Nonathletes | ||||||
| Men | 0.66 | 538 | 0.83 | 0.89 | 53 | 1.11 |
| Women | 0.58 | 136 | 0.73 | 0.86 | 54 | 1.08 |
| ≥60 y | 0.64 | 52 | 0.80 | 0.92 | 54 | 1.15 |
| Athletes | ||||||
| Men | 1.22 | 57 | 1.53 | 1.68 | 44 | 2.10 |
| Women | 1.43 | 33 | 1.79 | 1.51 | 21 | 1.89 |
| 1Population‑safe values are estimated from the pooled mean requirement (treated as EAR) multiplied by (1 + 2×CV), using CV = 12.5% per the FAO/WHO/UNU convention for inter‑individual variability in protein requirements at fao.org/4/aa040e/AA040E15.htm. | ||||||
Table 3 shows that the IAAO method results in much higher estimated requirements than the RDA, especially for athletes. The IAAO studies in the meta-analysis used a short (~8 h) acclimation period, which Tagawa et al. note may overestimate protein requirements (vs 24‑h balance methods).
Some researchers argue that people over 60 years old are less efficient at maintaining muscle and bone and therefore require more protein than younger adults (Gaffney-Stomberg, 2009; Paddon-Jones, 2008; Morais, 2006), with some of this research being supported by or connected to animal agriculture trade organizations (Gaffney-Stomberg, 2009; Paddon-Jones, 2008). Table 3 suggests that people ≥60 years old have a slightly higher protein requirement. But there is some conflicting research. A randomized trial of 92 men (average age 73 years) found no difference in lean body mass, muscle performance, physical function, well-being, or anabolic response to testosterone between those who consumed 0.8 g/kg/day and those who consumed 1.3 g/kg/day of protein for 6 months (Bhasin, 2018).
Comparing protein intake with mortality risk can serve as a reality check on protein requirements. In a meta-analysis pooling data from 31 cohorts, primarily from developed countries, total protein wasn’t associated with all-cause mortality across typical intakes of about 10–22% of calories (Naghshi, 2020). The data showed a possible increase in mortality above ~24% of calories. There appears to be a very wide range of protein intakes associated with longevity.
The RDA doesn’t include a higher protein recommendation for athletes. In a joint position paper on nutrition and athletic performance, the American College of Sports Medicine, the Academy of Nutrition and Dietetics, and Dietitians of Canada recommend 1.2 to 2.0 g/kg/day for athletes (Thomas, 2016). A meta-analysis of protein intake among strength athletes concluded that a daily protein intake of 1.6 g/kg/day, divided into 0.25 g/kg doses, is sufficient for muscle protein synthesis (Morton, 2018).
In conclusion, among omnivores, estimates of protein requirements vary considerably. For some people, even an amount below 0.6 g/kg of body weight might be enough. For strength athletes, 1.6 to even 2.0 g/kg might be optimal.
But what about for vegans?
Plant protein requirements
Summary. Protein requirements for individuals vary considerably, and there isn’t enough data to confidently differentiate between protein requirements for vegans and the general population. We recommend vegans aim for at least 1.0 g/kg, and older vegans err on the side of 1.2 to 1.3 g/kg.
Proteins are made out of chains of amino acids. Some amino acids can be made by the body, generally from other amino acids, but some cannot; those that can’t are known as essential. Essential amino acids are as important as protein needs, but because the essential amino acids are found in fairly consistent amounts in the average diet of Americans, the U.S. Recommended Dietary Allowance (RDA) for protein also covers amino acid needs.
A common belief is that most plant foods are devoid of at least one essential amino acid, but the truth is that all plant proteins have some of every essential amino acid. As a general rule, legumes are lower in the essential amino acid methionine, while most other plant foods are lower in lysine. In general, though, only lysine is likely to be a concern for most vegans because almost all vegans naturally eat plenty of foods high in methionine. Research suggests that if vegans obtain 0.85 g/kg/day of protein, they’ll meet the RDA for lysine (see Protein and Amino Acid Intakes of Vegan Men).
In the early 1970s, the book Diet for a Small Planet, by Frances Moore Lappé, popularized the idea of combining plant proteins at each meal to balance essential amino acids and form complete proteins. In particular, mixing legumes and grains ensures that a vegan is obtaining both lysine and methionine at each meal. We now know that vegans don’t need to worry about combining proteins at individual meals to create a complete protein, because our livers store essential amino acids for use as needed. The 2009 American Dietetic Association’s Position Paper on Vegetarian Diets stated:
Plant protein can meet requirements when a variety of plant foods is consumed and energy needs are met. Research indicates that an assortment of plant foods eaten over the course of a day can provide all essential amino acids and ensure adequate nitrogen retention and use in healthy adults, thus complementary proteins do not need to be consumed at the same meal.
There have been numerous scoring systems to rate the essential amino acid content of various proteins, but these scoring systems are mostly relevant to populations at risk of malnutrition. We provide an in-depth discussion of protein quality scoring in Appendix A. Protein Quality Scoring, including explanations of the protein efficiency ratio (PER), the protein digestibility–corrected amino acid score (PDCAAS), and the digestible indispensable amino acid score (DIAAS).
Even though protein quality isn’t a major concern, vegans should be familiar with and include plenty of high-lysine foods.
Summary of plant protein balance research
The results of protein balance studies of people on plant-based diets are compiled in the table below. The results are mixed, but they suggest that many vegans might benefit from at least 1.0 g/kg/day of protein.
| Table 4. Protein balance studies using plant-based diets | |||
|---|---|---|---|
| Study | Protein (g/kg/day)A | Legume Protein | Result |
| Doyle, 1965 | 0.5 | Amino acids matched milk | Subjects not in nitrogen balance |
| Doyle, 1965 | 0.75 | Amino acids matched milk | 100% in nitrogen balance |
| Bartholomae, 2023 | 0.8 | Protein was mostly legumes | Most vegans were probably in nitrogen balance |
| Register, 1967 | 0.91 | 0.55 g/kg/day | 75% in nitrogen balance |
| Haddad, 1999 | 0.93 | 1.2 servings per day | Normal albumin levels |
| Yáñez, 1986 | 1.0 | Small amount | 7 out of 8 in nitrogen balance |
| Andrich, 2011 | 1.0 | Lysine intake 79% RDA | Muscle mass similar to omnivores |
| Caso, 2000 | 1.09 | Not reported | 12% lower albumin synthesis than controls |
| Caso, 2000 | 1.34 | At least 0.25 g/kg/day | Normal albumin synthesis |
| Agrams per kg of body weight per day | |||
See Appendix B. Nitrogen Balance Studies of Plant-based Diets for a brief description of most of the studies, with a more detailed critique of Bartholomae and Johnston’s nitrogen balance study on vegans.
Plant vs. animal protein: observational research
Given that animal protein is often promoted as higher-quality than plant protein, it might surprise people to learn that the largest studies on protein intake and mortality risk have found that animal protein is associated with mortality, whereas plant protein is associated with longevity.
A meta-analysis pooling data from 31 cohorts found a ~5% lower risk of dying during follow-up for each 3% replacement of calories of animal protein with plant protein (on a 2,000‑calorie diet, that’s about 60 calories or ~15 g of protein). Heart‑disease deaths decreased as plant protein rose from very low levels up to around 10–13% of calories (Naghshi, 2020).
Among a cohort of U.S. health professionals, substituting 3% of calories (≈15 g/day at 2,000 kcal) of animal protein with plant protein was associated with ~10% lower all-cause mortality and ~12% lower cardiovascular mortality (Song, 2016). There were mortality reductions from replacing 3% of energy with plant protein for these animal products:
- Processed red meat: ~34%
- Eggs: ~19%
- Unprocessed red meat: ~12%
- Dairy: ~8%
- Fish: ~6%
- Poultry: ~6
These are incremental estimates within typical intake ranges and don’t reflect decreases to zero animal protein.
Amino acid intakes and blood levels of vegans
Researchers from EPIC-Oxford analyzed dietary intake and blood amino acid levels across various diet groups in adult men (Schmidt, 2015). The study included 98 men for each diet group (vegan, lacto-ovo-vegetarian, pescatarian, and meat-eater). On average, participants had followed their diet for several years.
Protein and amino acid intakes of vegan men
The vegan men in Schmidt et al.’s analysis of EPIC-Oxford were eating 0.85 g/kg/day of protein (calculations). Although the men were apparently healthy, protein balance wasn’t measured. It should also be noted that the protein and amino acid intakes were measured by a food frequency questionnaire, which the authors say might have underestimated the intakes of vegans.
Table 5 compares vegan amino acid intakes in EPIC-Oxford to the United States RDA for amino acids.
| Table 5. Essential amino acid intakes of vegan men in EPIC-Oxford | |||
|---|---|---|---|
| Amino Acid | Intake (g/day) | RDA (g/day) | Percentage of RDA |
| Isoleucine | 2.47 | 1.29 | 191 |
| Leucine | 4.33 | 2.85 | 152 |
| Valine | 2.95 | 1.63 | 181 |
| Histidine | 1.52 | 0.95 | 160 |
| Lysine | 2.82 | 2.58 | 109 |
| Methionine+Cysteine | 1.72 | 1.29 | 133 |
| Phenylalanine+Tyrosine | 4.79 | 2.24 | 214 |
| Theronine | 2.19 | 1.36 | 161 |
| Tryptophan | 0.77 | 0.34 | 226 |
| Weight of the participants wasn’t reported, but vegans had an average body mass index of 22.1 kg/m2. If we assume an average height of 175.3 cm for a British male (BBC, 2010), the average weight of the vegans was 67.9 kg. | |||
Vegan men met the RDA for all essential amino acids.
Lysine was the limiting amino acid in the diets of the vegan men; they surpassed the RDA by only 9%. The 95% confidence interval for lysine intake was 2.69-2.95 g/day, with a lower margin of 104% of the RDA.
The vegan men surpassed the RDA for methionine by the next lowest amount of 33%. Methionine is traditionally the second most concerning amino acid in vegan diets.
Vegans in the United States might consume more protein than those in the United Kingdom. The Adventist Health Study-2 from the United States found an average protein intake of 71 g/day for men and women combined (Average Nutrient Intakes), considerably higher than the 58 g/day for this subset of men in EPIC-Oxford (Schmidt, 2015).
Amino acid intakes of vegan women
As a percentage of body weight, the RDA for protein and amino acids is the same for women as for men.
Vegan women in EPIC-Oxford ate 56 g of protein per day (Average Nutrient Intakes), only marginally less than vegan men from Schmidt et al.’s subset of EPIC-Oxford, and so their amino acid intakes are likely similar.
As with men, Seventh-day Adventist vegan women in the United States most likely eat more protein than vegan women in the United Kingdom (Average Nutrient Intakes), suggesting that Seventh-day Adventist vegan women are surpassing the RDA for lysine and other amino acids.
A study of Danish vegans (Aaslyng, 2023) found that a high percentage of participants (36 women, 4 men) didn’t meet recommendations for protein and some essential amino acids. Although 3-day diet records were used, which are typically a reliable method to estimate intakes, energy appeared to be significantly underestimated, with 55% of the participants not meeting recommendations (despite an average body mass index of 24.8). Had food intake not been underestimated, a high percentage of participants would have likely been shown to meet recommendations, given that only one participant who met energy recommendations failed to also meet protein recommendations.
Amino acid plasma levels of vegan men
Schmidt et al. (2015) compared plasma amino acid levels across diet groups. Vegans had lower levels of lysine, methionine, tryptophan, and tyrosine, and higher levels of alanine and glycine. The researchers didn’t seem concerned by these differences.
Table 6 compares the plasma amino acid levels of vegan men in Epic-Oxford with the reference ranges provided by the U.S. National Library of Medicine (NLM). The NLM notes that these numbers are dependent on the specific laboratory methods used (NLM, 2016).
| Table 6. Plasma amino acid levels of vegan men | ||
|---|---|---|
| Amino Acid | Plasma µmol/l (95% CI) | Reference Range µmol/l |
| Alanine | 621 (595, 648) | 230-510 |
| Arginine | 44 (39, 48) | 13-64 |
| Asparagine | 98 (95, 102) | 45-130 |
| Aspartate | 69 (66, 72) | 0-6 |
| Citrulline | 40 (38, 42) | 16-55 |
| Glutamate | 262 (248, 277) | 18-98 |
| Glutamine | 547 (529, 566) | 390-650 |
| Glycine | 452 (434, 470) | 170-330 |
| Histidine | 117 (113, 120) | 26-120 |
| Isoleucine | 96 (92, 100) | 42-100 |
| Leucine | 191 (184, 199) | 66-170 |
| Lysine | 210 (201, 219) | 150-220 |
| Methionine | 27 (26, 28) | 16-30 |
| Ornithine | 205 (197, 215) | 27-80 |
| Phenylalanine | 97 (93, 101) | 41-68 |
| Proline | 244 (233, 256) | 110-360 |
| Serine | 197 (190, 205) | 56-140 |
| Theronine | 165 (159, 171) | 92-240 |
| Tryptophan | 65 (63, 68) | n/a |
| Tyrosine | 73 (70, 76) | 45-74 |
| Valine | 217 (209, 225) | 150-310 |
| The NLM provides a reference range for cystine (two cysteine molecules combined), but Schmidt et al. didn’t list plasma levels for cystine or cysteine. The NLM provides no reference range for tryptophan, with no explanation. | ||
Vegans had levels above the reference range for alanine, glutamate, glycine, leucine, ornithine (a non-protein amino acid), phenylalanine, and serine; aspartate was also elevated, but the reference range is surprisingly low. It’s unclear if these elevated levels have clinical significance.
Arginine and the vegan diet
People with herpes are often advised to limit their intake of the amino acid arginine in order to reduce symptoms. EPIC-Oxford found vegans to have a non-significant trend toward lower levels of arginine in the blood and also a lower arginine intake than meat-eaters (3.92 g/day for vegans, 4.13 g/day for meat-eaters); lacto-ovo vegetarians had the lowest intake at 3.36 g/day (Schmidt, 2015).
Appendix A. Protein quality scoring
One of the earliest ways to assess protein quality was the protein efficiency ratio (PER) which determined a score based on the growth of rats fed different proteins. The PER was criticized both for using rats and for not taking into account protein maintenance needs which led to the Food and Agriculture Organization (FAO) of the United Nations recommending other ways to determine protein quality.
FAO Recommends the PDCAAS in 1989
In 1989, the FAO recommended replacing the PER with the protein digestibility–corrected amino acid score (PDCAAS) as the “most suitable regulatory method for evaluating protein quality of foods and infant formulas (p. 42, FAO, 1991).” The FAO considered the PDCAAS to be an improvement over the PER because the PDCAAS-based protein scores on the needs of humans, specifically preschool-age children (p. 8, FAO, 1991).
The PDCAAS ranks a food’s protein quality based on its limiting amino acid which is the essential amino acid that the protein contains the least amount of in comparison to the reference protein, typically the milk protein casein (p.5, FAO, 1991). The PDCAAS scores each essential amino acid in a protein and then uses the lowest PDCAAS score for the overall protein, truncated at 1.00 (p. 35, FAO, 1991):
(mg of limiting amino acid in 1 g of test protein / mg of same amino acid in 1 g of reference protein ) x fecal true protein digestibility percentage
Table 11 (p. 39, FAO, 1991) provides the PDCAAS scores known by the FAO at the time. Only three animal foods are listed: casein (1.00), egg white (1.00), and beef (0.92). There are just over a dozen familiar plant proteins listed and their PDCAAS scores range from 0.26 to 0.69.
Although the PDCAAS ranks proteins according to human needs, it’s been criticized for calculating amino acid absorption, aka digestibility, based on fecal analysis of rats (Schaafsma, 2000). Rat digestion is different from humans, and a fecal analysis doesn’t take into account that bacteria in the colon can change the amino acid composition of the feces. The FAO recommended changing from fecal digestibility to ileal digestibility when agreed-upon procedures and sufficient data are available (p. 32, FAO, 1991).
The FAO implied that some of the PDCAAS might be based on human digestibility studies; they say “when human balance studies cannot be used, the standardized rat faecal-balance method of Eggum or McDonough et al. is recommended (p. 31, FAO, 1991).” But the abstracts for the citations of the PDCAAS scores given in Table 11 (p. 39, FAO, 1991) don’t indicate that any human data were used.
The PDCAAS has also been criticized for truncating protein scores at 1.00, which prevents the score from reflecting a food’s ability to complement other foods in the diet (Schaafsma, 2000). Only animal foods have PDCAAS scores high enough to be truncated.
The 1991 FAO report relied primarily on data from Sarwar and colleagues when listing the PDCAASs of foods (p. 39, FAO, 1991). Sarwar later published a paper suggesting that the PDCAAS method overestimates the quality of proteins for foods containing anti-nutritional factors (Sarwar, 1997), which are primarily plant foods.
FAO Recommends the DIAAS in 2011
In 2011, the FAO Expert Consultation on Protein Quality Evaluation in Human Nutrition was held to review the adequacy of the PDCAAS (FAO, 2013). The panel recommended changing how proteins are scored from the PDCAAS to the digestible indispensable amino acid score (DIAAS). The DIAAS uses the digestibility of specific amino acids rather than of entire proteins.
The DIAAS for a food is the lowest score for any of the essential amino acids (p. 3, FAO, 2013):
100 x (mg of digestible dietary indispensable amino acid in 1 g of the dietary protein / mg of the same dietary indispensable amino acid in 1 g of the reference protein)
DIAAS scores are not truncated at 100%. The ileal digestibility of each amino acid is preferably determined in humans, followed by growing pigs, and then growing rats (p. 4, FAO, 2013).
For infants, the DIAAS reference protein is the amino acid pattern found in human breast milk. For non-infants, the DIASS uses a reference protein based on the needs of humans. The DIAAS Reference Protein explains how they calculated the reference protein.
The FAO provides few examples of DIAAS scores. Table 6 (p. 44, FAO, 2013) provides a DIAAS score for whole milk powder (122), wheat (40), and peas (64).
Criticism of the DIAAS
Craddock et al. (2021) published a list of critiques of the DIAAS with respect to plant-based diets.
Much of Craddock et al.’s criticism focuses on the digestibility of plant foods, which they argue is underestimated by the DIAAS. They cite Tomé D. (2013), whose review paper provides a table of ileal food digestibility in humans. Rather than being markedly lower in digestibility than animal protein, Craddock et al. point out that “soy protein isolate, pea protein isolate, pea protein flour, wheat flour, and lupin flour exhibited 89–92% digestibility, approximating values of 90–95% for eggs, meat, and milk proteins.”
Here’s a list of Craddock et al.’s criticisms with brief explanations:
- Nitrogen-to-protein conversion factors influence animal and plant foods differently.
- The ratio of essential amino acids to total protein can be underestimated for plant foods when PDCAAS and DIAAS scores are calculated because the FAO doesn’t require food-specific nitrogen-to-protein conversion factors when determining the amount of protein in a food.
- There’s a limited number of fruits and vegetables within the DIAAS.
- Many plant foods won’t be included in an assessment of an entire diet because most don’t have DIAAS scores.
- A DIAAS diet score is of questionable relevance to those following plant-based dietary patterns in developed nations.
- Plant-based diets in food-secure regions will easily meet the needs for total essential amino acids. (In this criticism, Craddock et al. treat total essential amino acids as a whole and don’t analyze individual amino acids.)
- DIASS scores are based on animal digestion.
- The digestibility of amino acids in rats and pigs cannot be extrapolated to humans. (The FAO admits that rats are not an ideal model, but says that pig digestion approximates humans, while obtaining human data for a wide range of foods is impractical.)
- DIAAS scores for foods change when they’re part of a mixed diet.
- In mixed diets, the digestibility of proteins and amino acids changes, whereas DIAAS scores are based solely on single foods and give animal foods an inflated advantage.
- Digestibility of plant foods improves with heat treatment and processing.
- Raw foods are used for most DIAAS scoring, whereas protein-rich plant foods are typically cooked or processed, making them easier to digest.
- The DIAAS scores were never intended for athletes consuming a plant-based diet.
- The FAO endorsed the DIAAS as a tool to help the global population avoid malnutrition by meeting protein requirements, but hasn’t endorsed the DIASS for ranking proteins on the basis of their muscle-building potential. Craddock et al. cite research suggesting that proteins with higher DIASS scores don’t increase muscle hypertrophy.
Craddock et al. conclude that “emphasizing protein quality in developed nations is unproductive.” They say that if protein quality is to be assessed, the PDCAAS is the most suitable tool for Western adults on a plant-based diet.
It’s not clear why Craddock et al. believe that the PDCAAS is superior to the DIASS, given that most of their critique of the DIASS would similarly apply to the PDCAAS. Perhaps they prefer the PDCAAS because it truncates animal protein scores at 1.00.
The DIAAS reference protein
Because it’s hard to follow how the FAO determined the DIAAS reference protein for non-infants, I’ve included more details here, which require following along with the tables in their document.
For non-infants, the reference protein used in DIAAS scoring is a calculation of the amino acid needs, represented in Table 3 (p. 27, FAO, 2013) and narrowed down in Table 5 (p. 29, FAO, 2013).
The numbers in the bottom section of Table 5, Scoring pattern mg/g protein requirement, are calculated by multiplying the sum of the Maintenance and the Growth factor by the Amino acid requirements. The numbers derived in Table 3 (p. 27, FAO, 2013) are taken from a 2007 FAO report, which explains how they’re calculated (FAO 2007).
In the 2007 FAO report, Table 23 (p. 150) lists the mean adult requirement for each amino acid as determined by the committee based on a variety of methods and sources, typically human nitrogen balance studies in which specific amino acids are limited. The FAO’s 2007 amino acid requirements for adults don’t match the IOM’s estimated average requirement (EAR), but are relatively close.
Appendix B. Nitrogen balance studies of plant-based diets
Only one nitrogen balance study has been conducted on vegans. Bartholomae and Johnston (USA, 2023) performed a nitrogen balance study on 18 minimally active, healthy male vegans aged 31.6 ± 6.2 years. They fed them a diet with a protein content of 0.8 g/kg/d. After measuring nitrogen balance and applying their formula, the researchers considered only 3 vegans to be in positive nitrogen balance.
Nitrogen balance was determined after 5 days using the equation:
The mean absolute nitrogen balance was −1.38 ± 1.22 g/d, and was statistically lower than the nitrogen equilibrium score of zero (95% CI: −2.00 to −0.75), indicating that the average vegan wasn’t in nitrogen balance.
There were some limitations to this study. Instead of measuring non-UUN nitrogen losses directly, they used a factor of 4 g/d. They also allowed only 5 days for an adaptation feeding period, which is on the short end of standard protocol. Another limitation is that the equation for nitrogen balance used the typical protein nitrogen conversion factor of 6.25. The protein nitrogen conversion factor is the amount of protein typically represented by a given amount of nitrogen. Using a protein nitrogen conversion factor of 6.25 for plant proteins has been criticized (Mariotti, 2008; Craddock, 2021); Mariotti et al. recommend using a protein nitrogen conversion factor of 5.6 rather than 6.25 for mixed diets using animal and plant protein.
In our spreadsheet, Bartholomae & Johnston’s nitrogen balance study on vegans, we recalculated the average nitrogen balance using a conversion factor of 5.6, which results in a nitrogen balance of -0.25 g/d (95% CI: -0.87 to 0.38). Because Bartholamae and Johnston provide a sample menu used in the study, we were also able to derive a conversion factor of 5.435 from data in Mariotti et al. (2008). Using a conversion factor of 5.435 results in a nitrogen balance of 0.08 g/day (95% CI: -0.54 to 0.71). Although these are just estimates, they indicate that the vegans, on average, were likely close to nitrogen balance.
Doyle et al. (1965) conducted a study in two stages. In the first stage, eight young men were fed a vegan diet providing 0.50 g/kg/day of protein and an amino acid profile matching that of milk. Unsurprisingly, with such a low protein intake, the men weren’t in nitrogen balance. In the second stage, protein was increased to 0.75 g/kg/day using 0.25 g/kg/day of soy protein, and the men were, for the most part, in nitrogen balance.
Register et al. (1967) fed participants a vegan diet providing 0.91 g/kg/day of protein, of which 0.55 g/kg/day was legume protein, for 3 weeks. On the vegan diet, 9 out of the 12 participants were in nitrogen balance. They also found that the protein on a vegan diet was 2.6% less digested than the protein on a non-vegetarian diet. A third study placed young men on a near-vegan diet (except for 41 g of dried, skim milk) for 90 days, with 1 g/kg/day of protein(Yáñez, 1986). Some of the protein was from legumes (amount not reported). Seven out of the 8 subjects were in nitrogen balance.
Albumin is a blood protein that responds to varying amounts of dietary protein and can be used to assess protein needs. Caso et al. (2000) found a 12% reduction in albumin synthesis among men eating a 10-day diet of 63% plant protein compared to 26% plant protein; total protein was 78 g/day. Albumin synthesis returned to normal after 18 g/day of soy protein was added, increasing plant protein to 78% and total protein to 96 g/day. Participants were eating about 1.09 g/kg/day without the soy and 1.34 g/kg/day with the soy. The synthesis of two other proteins, prealbumin and transferrin, was also lower on the diet with 63% plant protein. The lower synthesis of transferrin, an iron transport protein, is interesting because lysine supplements have been found to increase iron absorption.
In a cross-sectional study, Haddad et al. (1999) found that vegans (10 men and 15 women) had significantly higher serum albumin levels than non-vegetarians. We estimated the vegans’ protein intake to be 0.93 g/kg/day (calculations); 10 of the 15 vegan women didn’t meet the protein RDA of 0.8 g/kg/day. The authors stated, “Although serum albumin may not be a sensitive indicator of protein nutriture, the higher concentrations suggest that the diets of the vegan participants were adequate in protein.”
Using data collected during the 1980s, Andrich et al. (2011) found similar muscle mass among vegan and non-vegan middle-aged women despite differences in protein intake of 1.0 g/kg/day for vegans and 1.3 g/kg/day for omnivores. Muscle mass was estimated using formulas based on creatinine clearance (a byproduct of muscle metabolism). The vegan women’s lysine intake of 30 mg/kg/day didn’t meet the RDA of 38 mg/kg/day. However, the study estimated vegan women to be consuming an average of only 1,511 kcal/day vs. 1,866 kcal/day for the omnivores despite similar body mass indexes (20.0 and 20.7, respectively), suggesting that food intake for the vegans was underestimated, possibly due to a lack of data on vegan foods.
Appendix C. Muscle synthesis studies
Summary: This appendix covers muscle synthesis studies using a vegan diet that weren’t conducted in a sports nutrition context. These studies found, among older adults, lower muscle synthesis after a plant-based meal compared to a meat-containing meal, but similar muscle synthesis over the course of a 10-day vegan diet that was high in protein (103 g per day). More research is needed before conclusions can be drawn.
Muscle synthesis during a 10-day vegan diet
After performing a study on muscle synthesis after a plant-based meal and finding that muscle synthesis was lower than after a meat-containing meal (details below in Muscle Synthesis after a Meal Containing Beef or Plant Protein), the same group of researchers compared muscle synthesis rates in a crossover study in which older people ate a vegan diet and then an omnivore diet (or vice-versa) for 10 days each (Domić, 2024, The Netherlands). Muscle synthesis was no different on a vegan diet than on an omnivore diet.
The vegan diet in this study contained an average of 103 g of protein per day. This high amount of protein was in part due to using high-protein meat alternatives and is significantly higher than what’s been found in typical vegan diets of 56-71 g of protein per day (see our article, Average Nutrient Intakes). For this reason, we can’t use this study to assume most older vegans are receiving an amount of protein that will result in as much muscle synthesis as a typical omnivore diet.
Two limitations of this study were that it didn’t measure muscle protein breakdown and cannot be assumed to necessarily be an accurate picture of muscle retention. Also, these older people were considered highly physically active based on large amounts of walking per day, which the researchers said was conducive to muscle synthesis.
Muscle synthesis after a meal containing beef or plant protein
Pinckaers et al. (2023, The Netherlands) conducted a crossover trial, which provided 8 older males and 8 older females (average age of 72 years) a meal containing beef or a meal containing plant protein from whole plant foods. Each meal contained 0.45 g per kg of body weight (roughly 36 g of protein); the meals had relatively similar essential amino acid (EAA) contents.
The animal-based meal resulted in a greater increase in blood EAAs, higher leucine levels, and higher markers of muscle and whole-body protein synthesis. Markers of muscle protein synthesis, on average, actually decreased during the six-hour post-meal period for the plant-based meal (as indicated by Figure 7 of the paper).
The authors summarize their concern:
Though we support the concept of moving toward a more plant-based diet for ethical, environmental, and health considerations, there are some concerns with regards to maintaining muscle health later in life. A more plant-based diet will likely provide health benefits, with many of those secondary to a low(er) energy intake due to the high fiber content and satiating effect of consuming more plant-based whole foods. However, the anabolic properties of each main meal may be of key relevance to stimulate muscle protein synthesis rates and, as such, to support muscle maintenance. This may be of particular importance for older adults, as the age-related loss in muscle mass is at least partly attributed to the attenuated postprandial muscle protein synthetic response to acute feeding in older compared with younger subjects.
A limitation of this study is that they didn’t measure changes in muscle mass, which are more important than markers of muscle synthesis. Other research, by Michell et al. (2023, Canada) found no association between post-meal markers of muscle synthesis and muscle mass after resistance exercise. Mitchell et al. write, “Clearly, however, acute early measures of [muscle protein synthesis] are not proxy measures for hypertrophy or hypertrophic potential within the same individual.”
Appendix D. Wound healing in vegans
Posso et al. (United States, 2025) conducted a review of studies examining the impact of wound healing in vegans and vegetarians. They reviewed eight studies (six from Italy, one from India, and one from Turkey), published between 2019 and 2022.
The studies measured wound healing after various types of skin surgeries, using a variety of scoring methods and clinical outcomes. Most of the studies had a small sample size and researchers were concerned that vegan or vegetarian patients were following an unbalanced diet. But the findings were consistent in that all studies showed vegans or vegetarians to have some level of poorer wound healing than omnivores.
The studies measured various nutrient-related levels. Vitamin B12 levels in vegetarians were consistently lower than in omnivores (approximately 200 pg/ml vs. 350 pg/ml), but remained high enough to suggest they are unlikely to affect healing. The review doesn’t indicate that any attempt was made to correlate nutrient levels with outcomes.
Posso et al. don’t report protein or zinc intakes, so it’s unlikely the studies measured them.
In How dietary protein intake promotes wound healing, Nancy Collins, PhD, RD, LD/N, FAPWCA, and Allison Schnitzer (2014) say:
It’s known that adequate protein is crucial for proper wound healing, but the precise amount isn’t established. Postsurgically, 1 to 1.5 g protein/kg is recommended, but this may vary with the extent of the surgical wound. For patients with pressure ulcers, the recommendation is also 1 to 1.5 g/kg; those with deep ulcers or multiple pressure-ulcer sites may need 1.5 to 2 g/kg. For patients with large burn wounds, protein requirements sometimes reach 1.5 to 3 g/kg to offset extensive protein loss through urine and burn-wound exudate.
Vegans in the EPIC-Oxford study had an average protein intake of 0.9-1.0 g/kg (Sobiecki, 2016). This suggests that vegans in the wound healing studies likely had an intake of protein near or below the lower recommended range for wound healing. The simplest explanation for the poorer wound healing among vegans is that they weren’t eating ideal amounts of protein.
Vegan zinc intakes can also be marginal without supplementation. A zinc intake low enough to impact wound healing also seems likely, but wasn’t measured in Passo et al.’s review.
Vegans with wounds should pay particular attention to obtaining adequate protein and may want to consider taking a zinc supplement of approximately the RDA (11 mg for men, 8 mg for women), in addition to obtaining the typical nutrients of concern in vegan diets (see Nutrition Tips for Vegans).
Bibliography
Aaslyng MD, Dam AB, Petersen IL, Christoffersen T. Protein content and amino acid composition in the diet of Danish vegans: a cross-sectional study. BMC Nutr. 2023 Nov 15;9(1):131. Erratum in: BMC Nutr. 2024 Apr 16;10(1):58. The erratum notes that the original paper used the terms “requirements” and “recommendations” in an ambiguous way.
BBC News. Statistics reveal Britain’s ‘Mr and Mrs Average’. 2010 Oct 13.
Caso G, Scalfi L, Marra M, Covino A, Muscaritoli M, McNurlan MA, Garlick PJ, Contaldo F. Albumin synthesis is diminished in men consuming a predominantly vegetarian diet. J Nutr. 2000 Mar;130(3):528-33. Protein per body weight calculations: Average healthy body weight of the men based on a BMI of 22 and average height of 1.74 m was 66.6 kg (78 g protein per 66.6 kg = 1.17 g/kg, 96 g protein per 66.6 kg = 1.44 g/kg). Actual average body weight of the men was 77 kg (78 g protein per 77 kg = 1.01 g/kg, 96 g protein per 77 kg = 1.25 g/kg). Averaging the healthy body weight with the actual body weight gives a range of 1.09 and 1.34 g/kg.
Ciuris C, Lynch HM, Wharton C, Johnston CS. A Comparison of Dietary Protein Digestibility, Based on DIAAS Scoring, in Vegetarian and Non-Vegetarian Athletes. Nutrients. 2019 Dec 10;11(12):3016. Not cited. Used DIAAS scores listed in the FAO 2013 report to calculate diet scores of lacto-ovo-vegetarians and meateaters.
Evans WJ. Protein nutrition, exercise and aging. J Am Coll Nutr. 2004 Dec;23(6 Suppl):601S-609S. Not cited.
Schaafsma G. The protein digestibility-corrected amino acid score. J Nutr. 2000 Jul;130(7):1865S-7S.
12 thoughts on “Protein Needs of Vegans”
Hi! The Protein and Amino Acids google sheet shows “Bread–whole wheat” as having 7 grams of protein, and “Spaghetti–whole wheat” with 8 grams of protein. But then the amino acids of the latter are roughly twice that of the former (e.g. 175 mg of Histidine for the Spaghetti, but 78 mg for the Bread) . That doesn’t seem like it can be right.
Dan,
You’re right, it looks like I forgot to double the amount of each amino acid in 1 slice of whole-wheat bread. I’m sorry for the inconvenience it caused you (and anyone else).
I could no longer find the exact entries (or they’ve changed the amounts) in the USDA database, so I’ve replaced the numbers and extrapolated the protein and amino acid amounts in whole-wheat bread from whole-wheat flour. I’ve linked them to the entries in the USDA database in the spreadsheet.
Hey Jack.
I’m never sure if I need Protein Powder or not [currently I use a half a scoop of mixed pea & rice PP]. I’m a bit concerned about the lead issue.
I eat decent protein sources like a tin of baked beans every day for lunch, lentils and more legumes in curry 4 days a week, oatmeal with soymilk every day, 4 Linda McCartney Sausages a week [over 2 dinners], etc.
I go walking 6 days a week for about 30 minutes. I do pushups 6 days pw, a small amount of dumb bell weights 3 days pw.
I’d like your thoughts.
Thank you.
Torin,
Most vegans don’t need to use protein powder. You might use an app to calculate how much protein you get on most days to be certain that you’re meeting your needs which I’d assume to be about 1.1 g/kg of body weight.
As vegans maybe be more prone to cold sores due to the arginine lysine intake, some may choose to supplement with lysine. But we need to be careful with this, as excess lysine supplementation can cause gallstones, and kidney problems. I think it’s worth vegans being aware of this.
Hayley,
I think it would only be people carrying Herpes simplex who are more prone to cold sores (if vegan). Here’s information from Medical News today about the side effects of lysine supplementation. I don’t recommend supplementing with lysine in order to meet daily lysine needs—I’d recommend obtaining it from food (or a moderate amount of a general protein supplement).
Thanks Jack. I’m a (mostly WFPB) vegan who gets cold sores and I’ve been taking lysine for years. I’ve only recently discovered the gallstones issue after finding out through a routine ultrasound that I have loads of small gallstones. I’m hoping by not supplementing with lysine anymore they will go away. Hopefully I can keep the cold sores at bay by upping lysine from food instead. Thanks for all you do. This site is one of my most trusted sources of unbiased vegan health info. I really appreciate it.
Thank you for your kind words. I hope your gallstones improve—good luck!
How many mL is the ‘cup’ spoken of in the tables above? Half a ‘metric cup’? ‘Half a US legal cup’? Half a ‘US customary cup’? (Presumably not half an ‘imperial cup’!)
Elvin,
We use the USDA nutrient database for most of the foods which presumably use a standard U.S. cup size. I couldn’t find documentation for it in a quick search of their website.
Hi Jack !!
I find a mistake on RDA MET+CYS of your article (https://veganhealth.org/protein-part-2/#amino-intakes-vegans) , the table named “Recommended Dietary Allowance (RDA) for Protein and Amino Acids” was talking to me 38mg RDA MET+CYS, but RDA is 19mg/kg ,
Then I saw a “number dancing” problem on the table; all the aminoacid numbers are one cell to the right, so all the values are wrong.
That’s the reason why “Protein” cell (the first one) is empty.
Cheers and congrats for your site,
Victor Robledo.
Victor,
Thanks for catching that! I’ve fixed it and the columns now line up properly.